Adam and Eve Family Tree - This chart shows the first twenty generations of Adam and Eve'sfamily tree.
Kings of Edom - This chart shows the Kings of Edom.
Patriarch Lifespans - This chart shows the lifespans of the Old Testament Patriarchs.
The Flood - This is a flash presentation showing how events at the time of the flood may have unfolded.
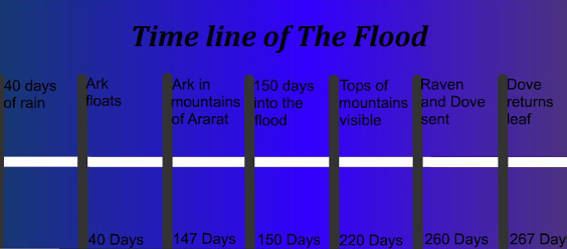
Flood Time Line - This is an interactive flash presentation showing the time line of the great flood.
Charts, Presentations and Time Lines
Gen 7:6 And Noah was six hundred years old when the flood of waters was upon the earth.

Custom Search